- Install
- Basic operation
- Basics of programming for electronic work
- Basics of programming for Excel
- Machine learning with scikit-learn
- Visualizing data with matplotlib
- Basic
- General chart
- Show a bar chart with only one series
- Show a bar chart with multiple series
- Draw a stacked bar chart
- Adding data labels to bar charts
- Show a line chart with only one series
- Show a line chart with multiple series
- Adding data labels to line charts
- Show a pie chart with only one series
- Show a pie chart with multiple series
- Statistical chart
- Web programming
- RPA programming
- Miscellaneous programming
- Reference
Adding data labels to bar charts
You can add data labels to individual bars in a bar chart to display individual values.
1. Add a data label block
After the block that creates the bar chart, add the "Add data labels to a bar chart" block.

Then, set the first parameter according to the type of bar chart.
You can also add data labels to bar charts with multiple series and stacked bar charts.
In the loop, add a block for "Add data labels to bar chart" after the block that creates the bar chart.
2. Set the position of the data label
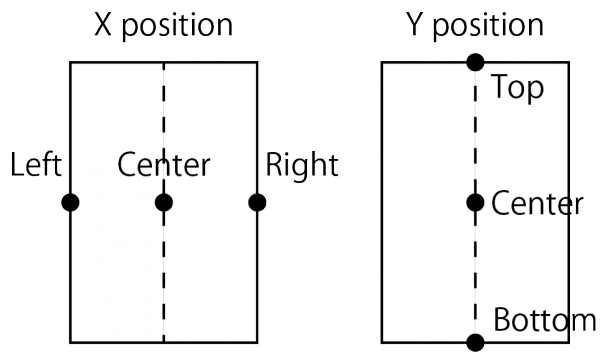
The "X position" and "Y position" parameters specify where on the bar the data label should be displayed.
The relationship between the values specified for each parameter and the position where the label is displayed is as shown in the figure below (the label is displayed at the ● position).
3. Setting the alignment of the data label
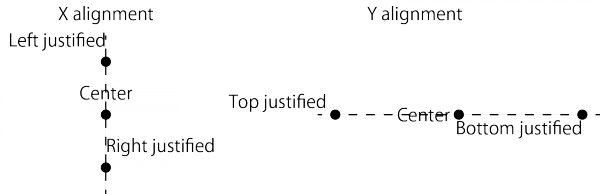
The "X alignment" and "Y alignment" parameters specify how to alignment the text based on the position determined by "X position" and "Y position".
The relationship between the values specified for each parameter and the reference point (position of the ●) and the label alignment is as shown in the figure below.
4. Other settings
By specifying the "X offset" and "Y offset" parameters, you can display the data label slightly shifted up, down, left, or right from the reference point.
The value is in pixels.
If you specify a positive value, the data label will shift to the right in the X direction and up in the Y direction.
If you specify a negative value, it will shift in the opposite direction.
You can also rotate the text by specifying the "orientation (degrees)" parameter.
0 degrees will make it horizontal, and a positive value will rotate it counterclockwise.
5. Examples
We will introduce examples of adding data labels to bar charts with only one series and bar charts with multiple series.
5-1. Bar chart with only one series
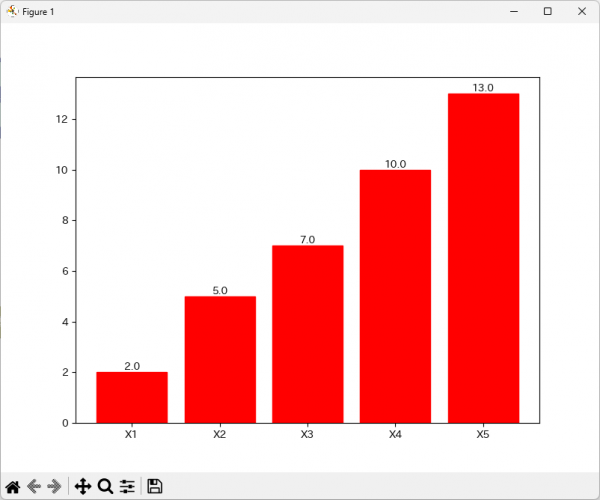
The following program is an example of displaying a bar chart like the one at the top of this page.
This program can be downloaded from here.
To run this program, download this file and open it in Excel.
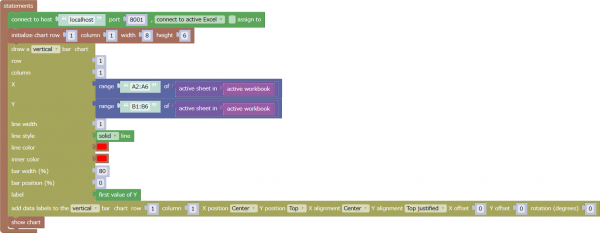
The X position is the center and the Y position is the top, so the center of the line at the top of the bar is the reference point for the label.
Also, because the X alignment is centered and the Y alignment is top-justified, the left and right positions of the labels are the same as the reference point, and the top and bottom positions are above the reference point.
5-2. Bar charts with multiple series
The following program is an example of adding data labels to a bar chart with multiple series.
This program can be downloaded from here.
When running this program, download this file and open it in Excel.
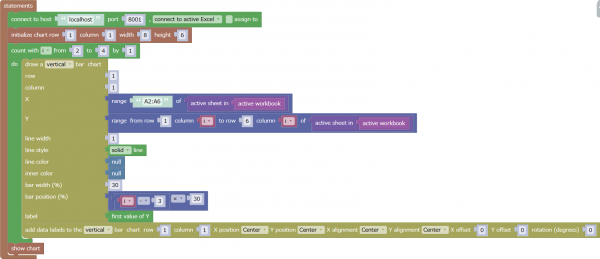
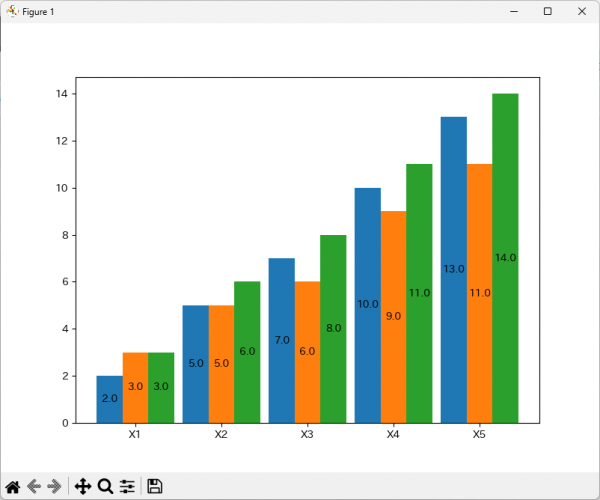
The result of running this program is as follows.
The X position/Y position and X placement/Y placement are all centered, so the data labels are displayed in the center of each bar.